


Frequently asked questions
Our team of experts has answered a series of questions commonly asked by pension trustees about Club Vita’s unusual service. The questions are grouped into six categories:
1. Introducing Club Vita
1.1 What is Club Vita?
Club Vita is a centre of excellence for improving understanding of human longevity, originally set up in the UK in 2009 and subsequently expanded into Canada and the USA.
Our core members are all trustees and sponsors of defined benefit pension schemes. Our club has also attracted a growing following of insurers, academics and advisors. All parties share a common interest in longevity and believe that the bigger the data, the lower the statistical noise.
Club Vita has developed a suite of longevity risk informatics to support pension schemes’ risk management strategies and enable innovative and efficient risk transfer mechanisms. Our informatics help trustees take control of longevity, so that it becomes an actively managed risk rather than an actuarial assumption.
1.2 How do you define longevity risk and how does it differ from mortality risk?
Mortality risk is the financial exposure to people dying sooner than assumed. It affects life insurance policies because there are fewer premium payments and less opportunity for investment growth when people die earlier than expected.
Conversely, longevity risk is the risk of people living longer than assumed. It is found in pension products like annuities and in equity release mortgages. Governments are particularly exposed to longevity risk because of unfunded pension promises and healthcare service expectations.
Combining mortality and longevity risks reduces the overall riskiness: the sum is less risky than the two parts in isolation due to inverse correlation.
1.3 Why is longevity risk often described as an “unrewarded” risk?
A pension scheme’s exposure to longevity risk is sometimes described as unrewarded because, unlike taking investment positions which are taken in the pursuit of reward, it receives no gain from taking the risk of pensions being in payment for longer than assumed. Equally, the scheme benefits if pensions are in payment for a shorter period than assumed. “Unmanaged risk” is perhaps a more accurate description of the pay-off profile than “unrewarded”.
Life insurers are in a stronger position to take longevity risk than pension funds because they can offset it against their mortality risk. Life insurers are seeking reward for taking longevity risk and have more strategies available to them than pension funds to actively manage the risk.
The key difference between investment risk and longevity risk, is that investment risk is rewarded: the scheme, on average and over the long-term, can earn a higher return from putting money at risk. Pension schemes get no upside from their exposure to longevity risk.
2. Solid data foundations
2.1 What makes your approach to data collection different to the way that actuarial tables have been traditionally produced?
- We collect data on postcodes and pre-retirement salaries, providing powerful explanations of differences.
- We don’t just look back for three years, but as far as the data is reliable, collecting more data points.
- We seek the same data items from everybody in the club – including postcode, gender and pre-retirement salary, creating a consistent data structure that can be sliced and diced in different ways.
- We apply deep cleansing techniques to get the most insight out of reliable and accurate data.
By investing in data collection, we are able to recommend individual survival assumptions for each member of your pension scheme, rather than crudely adjusting an off-the-peg table.
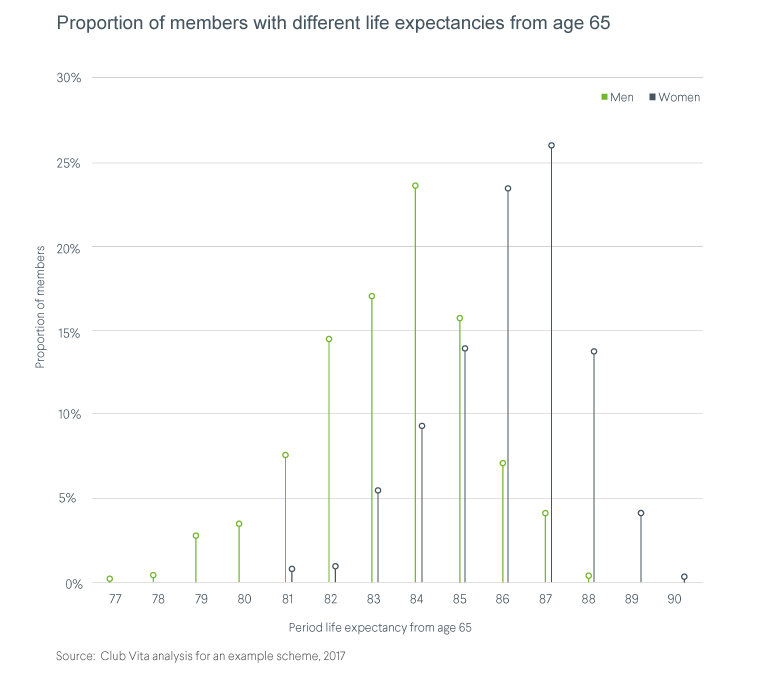
2.2 Why do you collect so many data fields?
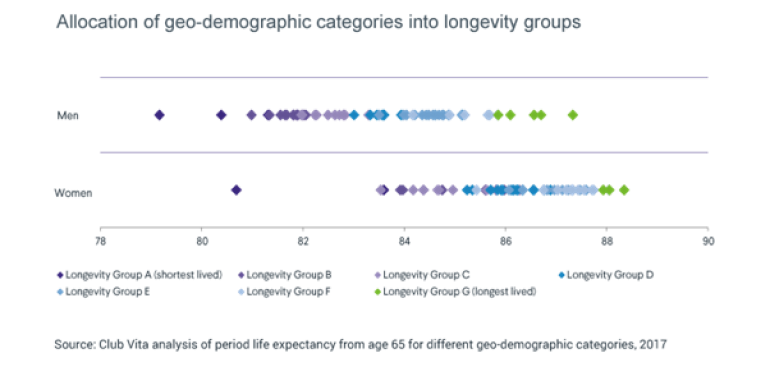
We only collect data fields that have been shown to have statistically significant effects on life expectancy. We regard our data request as the minimum viable items. This richness of data allows us to distinguish large differences in life expectancies within a single scheme’s pensioner population. Below is a chart showing how these life expectancies differ within a scheme:
2.3 Do you collect or link to any health data on the individual?
No. A pensioner’s administration records typically show whether someone retired early on grounds of ill-health, but we seek no information on the cause of any ill-health retirement, nor seek any data on current health of pensioners. That’s because we see insufficient benefit to the management of longevity risk in most group pension schemes.
Different people are ageing at different rates - our biological clocks are ticking at different rates. This is very relevant information when an individual person is buying a life insurance or annuity contract.
But our focus is on groups rather than individuals. Differences between people are diluted in group schemes, particularly when information on postcodes and earnings is collected. The marginal benefit of having health information on the individual person, over and above socio-economic data, quickly reduces as the population size increases. For defined benefit schemes with, say, 200 or more pensioners, there will be little or no benefit from collecting health data.
That is not to say that there are not material differences between the portfolio averages for schemes – we observe differences of up to six years in the portfolio averages, depending on the socio-economic mix of the scheme.
2.4 Will the data extract be difficult for our administrator to process?
No. Club Vita successfully receives data extracts on our standard data template from 12 different third party and numerous in-house administrators every year. It is becoming a routine process. We can put you in touch with those that have provided extracts at all leading administrators. We will also work with your administrators to make the process as straightforward as possible.
2.5 What's your policy on data security?
As you would expect, Club Vita operates rigorous data security procedures which have been designed to meet the specific nature of the club’s operations. We are proud to have achieved ISO27001 accreditation for our processes in the first year of operation, and to have maintained this in all our subsequent audits. We are happy to supply details of our processes to all prospective members.
3. The composition of VitaBank
3.1 You emphasise the importance of “solid data foundations”, but what does “good” data look like?
Whilst Club Vita’s has records on over 3m alive pensioners, size isn’t everything. Trustees should also be interested in:
- Relevance: the sample being representative of members of defined benefit pension schemes;
- Diversity: by occupation and region to avoid bias from any one group;
- Richness: collecting data on both postcodes and pre-retirement salaries provides an objective mechanism for grouping together people with similar longevity, so instead of a single table for all, we have 1500 tables for different types of people;
- Quality assurance: we fill in missing postcodes and check that alive pensioners really are alive;
- Consistency: it sounds like stating the obvious but pension administration records give us consistent information on alive and deceased people from the same source, that’s not true of ONS. The mix, particularly between socio-economic groups, is checked for consistency over time; and
- Flexibility: the data architecture enabling powerful multi-variate statistical techniques to be used.
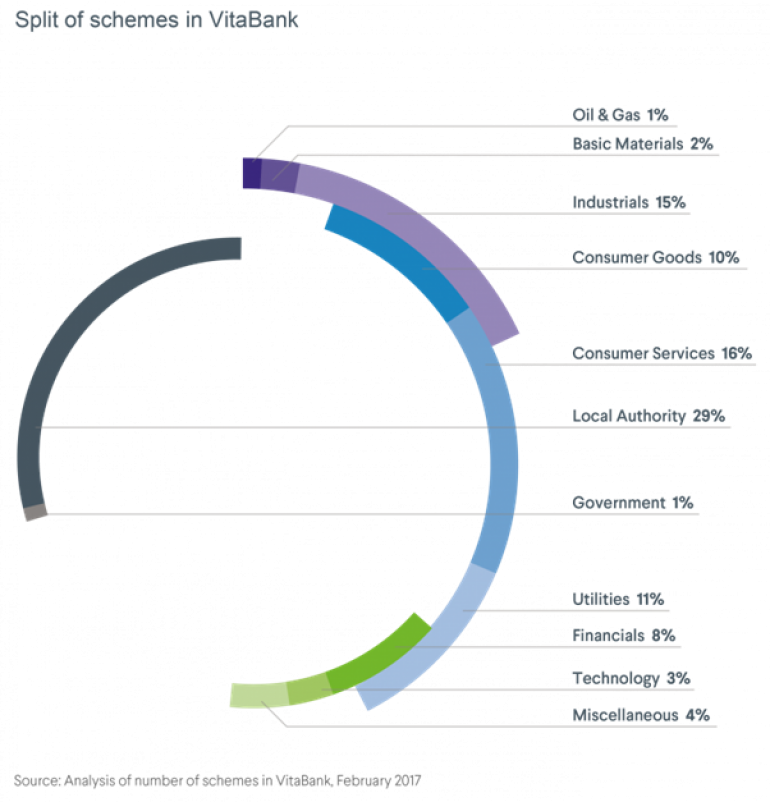
3.2 How diverse is Club Vita's data by industry sector?
The Club Vita data bank contains data from over 235 different pension schemes, across a wide range of occupations and industry sectors. The chart below shows that no one sector dominates.
3.3 Does the mix of public and private sector workers affect your modelling?
No. Whilst crude death rates are higher amongst pensioners who worked in the public sector than in the private sector, this is explained by defined benefit pension schemes being offered to more lower paid people in the public sector. Our statistical analysis tells us if you control for lifestyle and affluence (as we do in Club Vita’s models), the survival patterns of public sector and private sector pensioners are similar. Because Club Vita collects both postcode and salary, we can combine survival data from the public and private sectors into a single model.
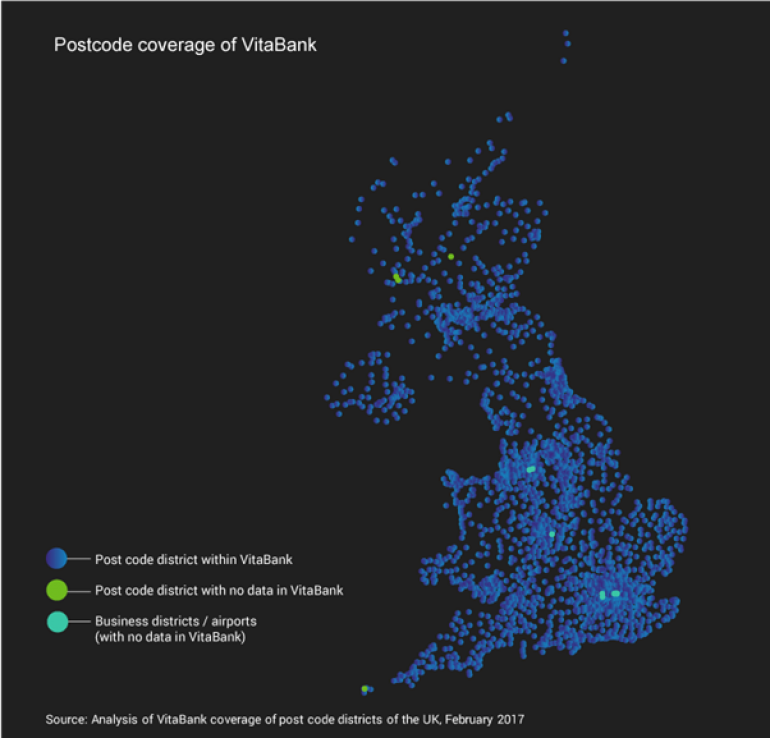
3.4 Is your dataset dominated by any region of the UK?
No, as you can see from the chart we have individuals from virtually all parts of the UK represented in the dataset. Moreover, variations in life expectancy are often observed between small neighbourhoods, rather than large regions as we discuss in Q4.1.
4. Increasing confidence in your baseline
4.1 Isn’t life expectancy linked to region, with lower life expectancy in north of England and in Scotland?
Yes and no.
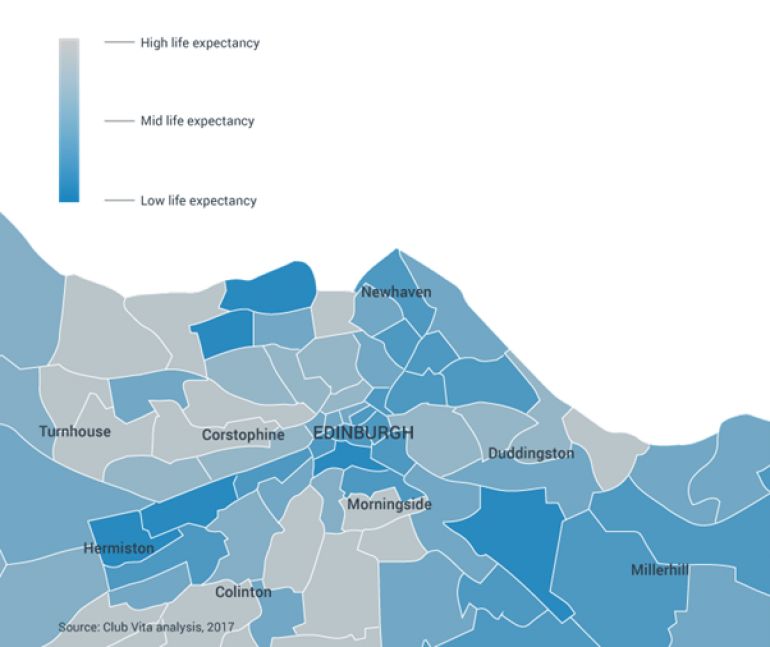
Whilst it is generally true that life expectancy is higher in the south and in rural areas, if you zoom in closer, you find that people with high and low life expectancy are dotted around the country often in neighbouring areas (see the map of Edinburgh below), for example.
The UK longevity map resembles a patchwork quilt, with variations associated with both affluence and lifestyle. For this reason, it makes more sense to study the longevity patterns of pensioners in small areas, rather than in large regions.
We regard postcodes as a proxy for both your affluence and your lifestyle. Importantly, as well as postcodes, we have also successfully collected salary before retirement for the majority of our pensioners. In combination, salary and postcode create a more predictive model than postcode does on its own. This is one of the reasons why Club Vita’s model explains a life expectancy variation of over 10 years, wider than other models.
5. Understanding longevity trends
5.1 How do Club Vita members get insights into emerging trends?
We track changes in survival rates in three broad socio-economic groups, which we call Comfortable, Making Do and Hard Pressed. Collectively, we call these groups VitaSegments. There are around 10,000 deaths in each VitaSegment each year.
We believe socio-economic groups are the best way of segmenting the population because:
- differences in longevity follow lifestyle and environmental factors;
- there are material differences in the socio-economic profiles of individual schemes, so one size does not fit all;
- the liabilities in the Comfortable group have disproportionate weight given the size of the pensions.
Our approach means that you can tailor your assumptions to the characteristics of your scheme, and you can monitor the emerging experience and take earlier action.
5.2 How can Club Vita help our trustees form an independent view of the prudence of our reserving for longevity?
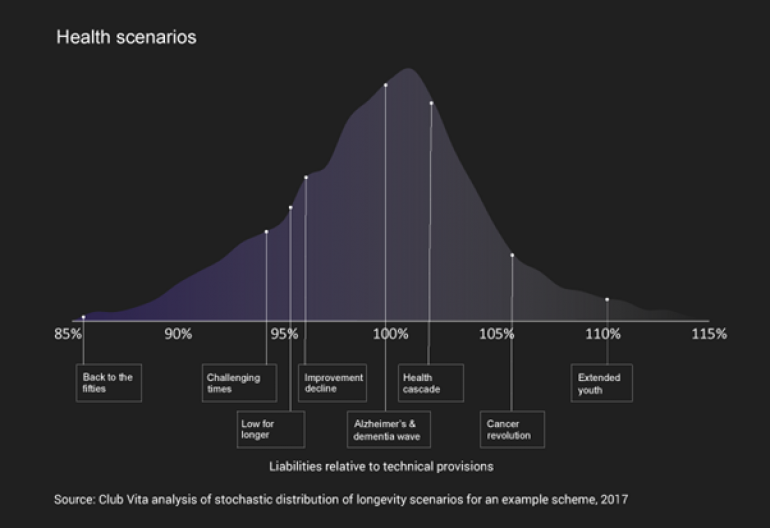
Club Vita uses “stress-testing” techniques to help trustees visualise how their pension promises would react under a series of alternative views of the world, relative to their actuary’s recommendation and a statistical simulation model (blue line). Our scenarios simulate how future survival rates change under alternative outcomes for future healthcare and economic prosperity. The impact of these scenarios on the capital value of your future obligations is illustrated in the chart for a sample scheme below.
This discipline quantifies the scale of uncertainty in future trends, letting you assess the level of prudence in your actuary’s recommendation for longevity trends. Similar techniques are used by insurers in their internal governance.
5.3 Surely longevity is not relevant because I am doing a buy-in?
Virtually all buy-ins and buy-outs now have longevity reinsurance built into the price at the point of sale. This is a consequence of Solvency 2 rules requiring more capital to be held by insurers for longevity risk.
So, although pension funds may not be aware, it is increasingly common for the price of a bulk annuity policy to be formed of the asset cost plus the premium for longevity reinsurance.
Club Vita can help you get the lowest price for the longevity reinsurance component by helping with your homework: data cleaning, reconciliation of historical experience with assumptions and checking out your indicative price for longevity insurance from VitaHedge to figure out what you are paying for the asset component.
6. Adopting Club Vita’s insights in your scheme governance cycle
6.1 How can my trustees feel more in control of longevity, reducing the risk of surprises at each three yearly valuation?
For most schemes, the start of the journey is quite philosophical. We encourage you to think of longevity as a risk that should be proactively managed, rather than an actuarial assumption with the capacity to inject volatility into your funding plans.
Club Vita’s role is to provide relevant information to enable a more active management of longevity risk, helping your advisors to strengthen their advice and trustees to feel more confident.
We have sketched out a six step journey to illustrate how Club Vita’s services enable you to perform annual reviews of longevity experience and take data-driven decisions.
6.2 Is Club Vita accepted by auditors and regulators?
Yes, our VitaCurves model complies with the professional requirements of UK actuaries, set by the Financial Reporting Council. It has been used in many actuarial valuations which have been reviewed by the Pension Regulator. And the PPF uses Club Vita in its own risk management.
6.3 Will our consultants be able to use your VitaCurves model?
Yes, base table results can be provided to your actuarial advisor in a variety of different formats. Depending on your preference we can provide any of the following:
- VitaCurves mappings for each individual member to enable full flexible “bottom-up” valuations
- Bespoke mortality tables to use for the main sections of your scheme (usually male and female tables for pensioners, deferreds and actives)
- Weightings to apply to standard actuarial tables
Additional analysis provided by Club Vita is included in your annual suite of reporting and we will work with you and your advisors to ensure you can get the most out these results.
In addition 7 out of 10 longevity reinsurers now use the VitaCurves model. This means that you will have a common language when interacting with buy-in, buy-out or longevity swap providers.
6.4 My actuary does a lot of this. Can Club Vita add any extra value?
Many actuarial firms provide baseline mortality assumptions tailored to scheme characteristics using postcodes (and maybe other factors). Club Vita does this and much more, for example:
- we benchmark your experience against your peers and monitor against your valuation assumptions;
- we perform regular research on trends over time, split by socio-economic groups (jointly with the PLSA);
- we provide indicative pricing for longevity insurance, without needing an expensive broking process; and
- we provide annual data review and cleansing.
Club Vita’s insights are designed to support your advisors in implementing your ongoing integrated risk management plan. We are also always on hand to discuss current trends and thinking in longevity.
Meet the team
Club Vita could not deliver the vast array of statistical insights without our gifted team.